CS21 Lab10: ZIP Codes -- Options...
Creating the graphics window
Let's use the state of Iowa as an example. Iowa's latitude ranges from a minimum of 40.542856 to a maximum of 43.464701; Iowa's longitude ranges from a minimum of -96.509390 to a maximum of -90.218704. The aspect ratio of Iowa can be computed by taking the difference between the min and max latitude (the y coordinate) and the difference between min and max longitude (the x coordinate), and then computing their ratio. For Iowa, this turns out to be approximately .4645 since Iowa is wider than it is tall (see a map of Iowa). This means that when drawing Iowa, the dimensions of the graphics window in the y dimension (up/down) should be approximately .4645 times that of the x direction (left/right). You will want your graphics window to have a fixed size in the x direction of 500 pixels. You will need to compute the size of the y direction based on the aspect ratio.Plotting the points
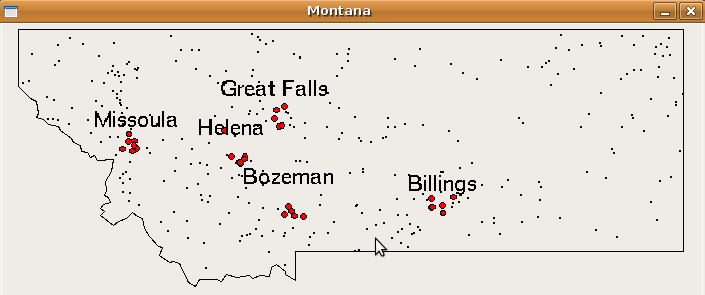
Before plotting the points, you will want to first use setCoords to set the coordinates of the window to match the min/max latitude/longitude of the state you are drawing.To plot the points, simply draw a black Point at each latitude and longitude in the zipcode database that corresponds to the state the user entered. For cities with a population larger than 250000 (or some smaller threshold for "flyover" states), you should draw a small red Circle, rather than a Point. Be sure that the size of your circle is proportional to the size of the coordinate space you are drawing in. Doing this will ensure that red circles you are drawing in Connecticut (a small state) will have the same size circle as cities in Florida (a large state).
For example, below is the picture of Montana produced from this data (the boundary polygon comes from another source. If you are interested in this, contact Prof. Danner.) After plotting the points, wait for a mouse click to close the window.
