CS21 Lab10: ZIP Codes
You may work with one partner on this assignment. If you work with a partner, put your name and the name of your partner in the list of authors at the top of your program. Only one partner needs to run handin21 to submit the files for the group. Both partners will receive the same grade.
Some of the problems will have optional components that allow you to
further practice your skills in Python. Optional portions will not be
graded, but may be interesting for those wanting some extra challenges.
Run update21, if you haven't already, to create the cs21/labs/10 directory. Then cd into your cs21/labs/10 directory and create the python programs for lab 10 in this directory (handin21 looks for your lab 10 assignments in your cs21/labs/10 directory):
$ update21

$ cd cs21/labs/10
$ vim zipcode.py
The file /usr/local/doc/zipcodes.txt contains the data you need to write your program. Each line of the file contains seven fields separated by commas representing the ZIP code, latitude, longitude, city name, county name, state, and population, respectively. The entry for Swarthmore is shown below:
19081,39.897562,-075.346584,Swarthmore,Delaware,PA,9907
The full file has entries for 41824 unique ZIP codes. You can open up the file in vim or any other text editor if you would like to look at the file in more detail. When you read in a line from this file in python you can use line.split(",") to separate the line into a list of strings.
Your program should prompt the user for two cities. The user can lookup a city by ZIP code or by a city name and its two letter state abbreviation. For each city, display the following information:
- City, State and ZIP
- County
- Population
- Latitude and Longitude
- Next closest city with a population over 100,000
In addition to the information above, display the distance between the two cities the user typed.
A sample run is shown below:
This program creates a database of information about cities
throughout the United States.  It allows you to enter two
cities (either by zip code or by city and state) and reports
the distance between them.
--------------------------------------------------------
CITY #1
Enter a zip code or city, state> Swarthmore, PA
 City, State, ZIP:  Swarthmore, PA, 19081
              County:  Delaware
        Population:  9907
         Lat / Long:  39.90 / -75.35
Closest big city:  Philadelphia, PA (6.1 miles)

CITY #2
Enter a zip code or city, state> 59453
 City, State, ZIP:  Judith Gap, MT, 59453
              County:  Wheatland
        Population:  307
         Lat / Long:  46.68 / -109.64
Closest big city:  Billings, MT (77.7 miles)

Distance between Swarthmore, PA and Judith Gap, MT is 1771.9 miles

Check more locations (yes/no)? yes
--------------------------------------------------------
CITY #1
Enter a zip code or city, state> San Francisco, CA
 City, State, ZIP:  San Francisco, CA, 94101
              County:  San Francisco
        Population:  776733
         Lat / Long:  37.78 / -122.73
Closest big city:  Daly City, CA (15.2 miles)

CITY #2
Enter a zip code or city, state> Boston, MA
 City, State, ZIP:  Boston, MA, 02101
              County:  Suffolk
        Population:  359585
         Lat / Long:  42.37 / -71.03
Closest big city:  Cambridge, MA (2.9 miles)

Distance between San Francisco, CA and Boston, MA is 2709.5 miles

Check more locations (yes/no)? no
If you cannot find an entry for a particular city or ZIP code, inform the user that you cannot find that location and prompt them to enter another location.
- For each location, store all the information for that location in a list. ZIP, city, county and state should be stored as strings. Latitude and Longitude should be stored as floating points, and the population should be stored as an integer. For example, the variable zipinfo displays the proper format for Swarthmore
zipinfo=['19081', 39.897562, -75.346584, 'Swarthmore', 'Delaware', 'PA', 9907]
Note that some elements in this list have quotes to indicate they are strings while numeric elements do not have quotes. When you use line.split(",") when reading an input line from the file, latitude, longitude, and population will not be automatically converted to numeric types - Store information about all locations in a single list, where each element in the list is a list describing one location as described above. You are thus creating a lists of lists. Using the example zipinfo above, the following code creates a list containing one location, and retrieves the name Swarthmore
allZips = [] #a list
allZips.append(zipinfo) #add a list as the first item to allZips
print len(allZips) #what is this? 7? 1? 2? something else?
location = allZips[0] #a list with zip, lat, long, ....
print location[3] #prints Swarthmore
If you read the file zipcodes.txt sequentially, the lines are sorted by increasing zipcode. You must preserve this order in you list of all locations. - When searching for a location by ZIP code, you must use binary search to find the location in the list of all locations. This binary search should return all the info for the location (zip, lat, long, ...) as a single list if a matching ZIP code is found. If the ZIP is not found, your binary search should return None. If you run update21 You will get starting point code for binary search based on the algorithm we described in class. This version is not designed to work on lists of lists though and must be modified slightly to work for this assignment.
In addition to the requirements above, we have included some tips and problems to watch out for below.
Some large cities (Philadelphia, PA, for example) have multiple ZIP
codes. When asked to report a ZIP code for a city, you can decide how to
handle this. Possible options include reporting all ZIP codes for a
particular city, reporting the first ZIP code you find for that city,
reporting one example ZIP code and stating there are other possibilities,
or designing a method of your own choosing. You must report at least one
ZIP code for a city if it is in the list of known cities.
Be careful when reporting the closest city to a given city. Do not report
the same city. For example, the city with a population over 100,000
closest to Philadelphia, PA, should not be Philadelphia, PA, but some
other city. This is further complicated by the fact that many big cities
have multiple ZIP codes, when reporting the closest big city, ensure that
the city names are in fact different.
You should use the "great circle" distance formula to compute the distance between two cities. If the first city is at a geographic location (lat1, long1), and the second city is at (lat2, long2), then the distance between the two cities is given by the formula:
D = R acos( sin(lat1)sin(lat2) + cos(lat1)cos(lat2)cos(long2-long1))
Where R is the radius of the Earth (6371 km or 3963 miles), and acos is the inverse cosine. You can get this function by importing the math module in python. Note that each lat/long must be converted from degrees to radians before computing a sine or cosine. The formula for this conversion is
rad = deg*pi/180or use the python function radians imported from the math library.
This data file we have provided you is by no means complete. Some ZIP
codes were missing or did not have lat/long data and were removed. For
some cities, we did not have population data, so we set the population
arbitrarily to 0. If your favorite US city or hometown in the US is
missing and you know all the info (ZIP, city name, county name, state,
lat, long, and population), let us know and we will be happy to add a few cities, but we are not trying to maintain a comprehensive list.
k-closest cities
Instead of printing the closest city with a population over 100,000 (or some other threshold), find the k-closest large cities. Make sure that your cities are distinct. For example, if the user asks for the five closest large cities to Swarthmore, do not report five separate ZIP codes that are all located in Philadelphia.Most isolated city
Find the city whose population is less than 100,000 (or some other threshold) and whose closest city with a population over 100,000 is furthest away. What happens as you change the population threshold? Note that this computation could be very time consuming. It might help to first build a separate list or dictionary of only the cities with a population over 100,000. There are only 224 such cities in our list, but these cities have over 6800 ZIP codes. On my desktop, computing the closest city out of all possible cities for 10 separate cites took just under two seconds. For 1000 separate cities the calculation takes just over two minutes. Computing the distance between every pair of cities in the data set would take about an hour and a half. I don't recommend waiting that long for this assignment.Creating the graphics window
Let's use the state of Iowa as an example. Iowa's latitude ranges from a minimum of 40.542856 to a maximum of 43.464701; Iowa's longitude ranges from a minimum of -96.509390 to a maximum of -90.218704. The aspect ratio of Iowa can be computed by taking the difference between the min and max latitude (the y coordinate) and the difference between min and max longitude (the x coordinate), and then computing their ratio. For Iowa, this turns out to be approximately .4645 since Iowa is wider than it is tall (see a map of Iowa). This means that when drawing Iowa, the dimensions of the graphics window in the y dimension (up/down) should be approximately .4645 times that of the x direction (left/right). You will want your graphics window to have a fixed size in the x direction of 500 pixels. You will need to compute the size of the y direction based on the aspect ratio.Plotting the points
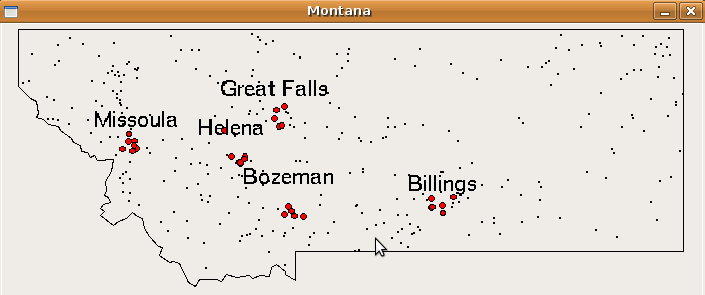
Before plotting the points, you will want to first use setCoords to set the coordinates of the window to match the min/max latitude/longitude of the state you are drawing.To plot the points, simply draw a black Point at each latitude and longitude in the zipcode database that corresponds to the state the user entered. For cities with a population larger than 250000 (or some smaller threshold for "flyover" states), you should draw a small red Circle, rather than a Point. Be sure that the size of your circle is proportional to the size of the coordinate space you are drawing in. Doing this will ensure that red circles you are drawing in Connecticut (a small state) will have the same size circle as cities in Florida (a large state).
For example, below is the picture of Montana produced from this data (the boundary polygon comes from another source. If you are interested in this, contact Prof. Danner.) After plotting the points, wait for a mouse click to close the window.
Once you are satisfied with your program, hand it in by typing handin21 in a terminal window.