Make sure all programs are saved to your cs21/labs/07 directory. Files outside this directory will not be graded.
$ update21
$ cd ~/cs21/labs/07/This is a two-part lab that is split over two weeks.
For the first week you will focus on using top-down design to create the overall structure of the program. Once your proposed structured has been reviewed and approved by your professor, you will use bottom-up implementation to complete the full program.
We encourage you to submit your top-down design a few days before the due date so that we have plenty of time to give you feedback. The sooner you get feedback from us, the sooner you can start implementing your design.
Read through this entire lab write up before you begin.
In this lab you will write a program called getfit.py that creates a graphics display to help users track the number of steps that they walk in a week. You will read their weekly data from a file. Each line of the file contains a day of the week, a comma, and the number of steps the user walked on that day. You can assume that every data file has seven days worth of data. For example, here's the contents of the file week1.data:
Mon,12345
Tue,5671
Wed,10975
Thu,8909
Fri,4655
Sat,11412
Sun,10402
Here is a sample run of the program using the above data file:
$ python3 getfit.py
Enter filename with step data: week1.data
Enter step goal: 10000
Enter width of window: 400
Enter height of window: 400
Notice that the graphic display contains a summary section at the top, showing the daily step goal, the average number of steps per day, and the total number of steps that week.
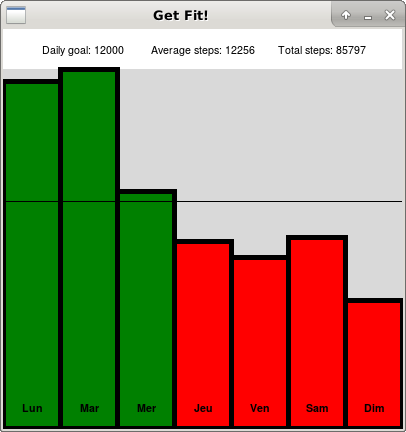
The bottom section of the graphic display consists of a bar graph where the height of each bar is proportional to the number of steps walked on that day. Each bar is labeled at the bottom with a three-letter shorthand for the day of the week. Each bar is color coded based on whether the user met their goal for that day (green for yes, red for no). In addition, a horizontal line marks the level of the step goal for that week. However, if the step goal for the week exceeds maximum of the daily step counts, then the line should not be drawn.
A key feature of your graphic display is that it must scale to the given window size. Imagine that users might want to view your program's output on a phone, tablet, laptop, or desktop. The graphic display should be readable in any dimensions.
The next section provides a number of additional sample runs of the program.
In this sample run we use the same data file as above, but this time we set a higher step goal of 12000 steps per day. With this higher goal, more of the bars are now colored red. Also, notice that the program requires that the numeric input must be within valid ranges.
$ python3 getfit.py
Enter filename with step data: week1.data
Enter step goal: -10
Invalid entry: Must be between 1000 and 20000
Enter step goal: 100000
Invalid entry: Must be between 1000 and 20000
Enter step goal: 12000
Enter width of window: 100
Invalid entry: Must be between 200 and 2500
Enter width of window: 400
Enter height of window: 1800
Invalid entry: Must be between 200 and 1300
Enter height of window: 400
Our goal is to have everything in the window scale to the given width and height. In this sample run, the window is wider than it is high. Notice that the bars are wider and the text is larger than it was in the previous examples.

In this sample run, the window is higher than it is wide, making the bars taller and narrower than in previous examples. Notice that the tallest bar always fills the lower section of the window.

In the next sample run, another data file is used called week2.data. Notice that in this file the days of the week are the shorthand for the French days: Lundi, Mardi, Mercredi, Jeudi, Vendredi, Samedi, Dimanche. Your labels for each bar must use the days of the week given in the data file, rather than assuming they will always be in English.

To scale the width of the bars, use the width of the window divided by 7 to get the number of pixels per day.
To scale the text, set the size of the text based on a percentage of the graphic window's width.
NOTE: This tip is COMPLETELY OPTIONAL. By default GraphWin puts the origin of the graphics window in the upper-left corner. For drawing the bar graph, it would be more convenient to have the origin in the lower-left corner, making Y-values increase towards the upper-half of the window. This can be accomplished using the method setCoords as shown below. However, if you are comfortable with the current configuration, feel free to ignore this tip.
window = GraphWin( ... )
window.setCoords(0, 0, window.getWidth(), window.getHeight())Create your top-down design in the file design.py.
Remember to run handin21 before midnight on March 22 to submit your design.
Once you get feedback from your instructor on your top-down design, copy your design file as shown below.
$ cd cs21/labs/07
$ cp design.py getfit.py
Write your solution in the file getfit.py. Remember to do bottom-up implementation, working on one function at a time, and testing that function before moving on.
You are required to check for valid input for any numeric input from from the user, including the step goal and the window dimensions:
You are not required to check if the user enters a valid file name.
Once you are satisfied with your getfit.py program, fill out the questionnaire in QUESTIONS-07.txt. Then run handin21 a final time to make sure we have access to the most recent versions of your file.